Graph Theory for Reverse Engineers
May 15, 2025
8 mins read

Or “everything actually is a nail, you just need a bigger hammer”
Graph Theory is a really neat subject matter relating to the modeling of pairwise relations between objects. When you understand graph theory, everything steadily becomes a graph theory problem, because pretty much anything can be.
As with when you have a hammer; everything looks like a nail. Those smarter than me will know the obscure algorithms and mathematics to do something efficiently. We’re lucky to have those people in our lives, but there’s always alternative solutions derived from adverse perspectives that will always work. For instance, if something isn’t a nail, your problem is really just that you need a bigger hammer to make it so.
In this blog we’ll cover the minimal amount of subject matter needed to make it approachable, drop a lot of reference links for further reading, cover tools I like to use, and finally take a massive step back and:
Present a simple, short, pure python stdlib approach to visually model a graph of arbitrary binary data streams of arbitrary length.
Graphs
I’ve talked obliquely about graphs before. Honestly, it’s a huge subject matter to cover. I’ll try to keep it simple and directed (ha!) for our objective.
A graph is an ordered pair of nodes and edges. I’ll be using d2 to model the subject so that links are available and can be played with.
A directed acyclic graph (DAG) may be:
Nodes: a, b, c
Edges: a -> b, b -> c
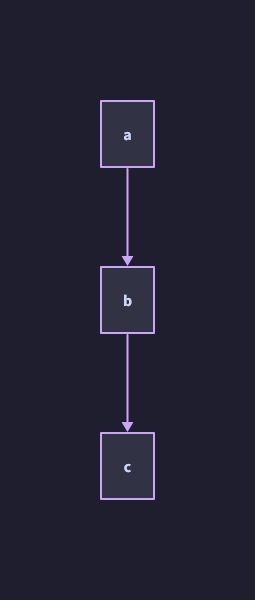
The above graph is acyclic, as in it doesn’t have cycles. “What’s a cycle?” you may ask. Well, that’s pretty easy to demonstrate.
Edges: a -> b, b -> c, c -> d, d -> b
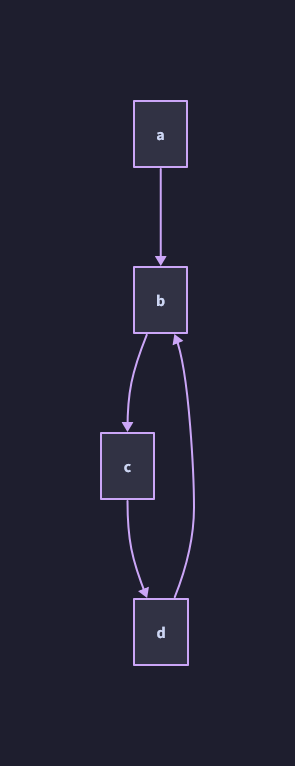
Starting from a and iteratively following the direction of the graph, how would you find an “end” of the graph? The first graph (directed acyclic graph) is quite easy; it ends at c.
However, in the second graph (directed cyclic graph) there is no “end”. Instead you would traverse each directed edge of the graph, taking note of the nodes and edges you have visited.
As you might imagine, from a programming perspective, the DAG is much easier to work with and process. Let’s stick with that.
Tooling
There’s many, many, many serialization types (file formats) for graph representations.
I’m a fan of d2 which was used for the images above, but there’s other’s like MermaidJS commonly used for drawing diagrams on Github README’s, and JSON Canvas as used by Obsidian my favorite note taking app.
If you want programmatic bindings and interactive visualizations, yet again I recommend d2 as a general purpose solution (it has Golang bindings, among other things). However, I’m also a big fan of Cytoscape which is a heavy hitter for large datasets with nice ontological features and layout algorithms built in. I also enjoy NetworkX for working with larger datsets and easy access to various algorithms when you’re not working with an “easy” graph. There’s also GraphViz, which will do absolutely anything you want, at a cost that doesn’t involve money.
Serialization
Almost all of the tools above use some specific file format to best utilize their particular features. Some have overlapping support for file formats. However, almost all of them support loading a CSV of nodes and edges. Let’s stick with that. The only problem with CSV is that the loader of your CSV may not want to solve for the thing that makes your desired DAG… a DAG.
We need some constraints on our data model that we can later write to a CSV easily. Pretty much everything can support running or embedding a SQLite database which enables you to implement constraints, and then just move on with your life.
Here’s a handy snippet.
CREATE TABLE IF NOT EXISTS "edges" (
  -- Each edge is given a numerical id
  "id" INTEGER,
  -- source node label of the edge
  "src" TEXT,
  -- destination node label of the edge
  "dst" TEXT,
  -- Count of how many times this edge has occurred
  "ct" INTEGER,
  -- Ensure that each edge gets a unique id
  PRIMARY KEY("id" AUTOINCREMENT),
  -- Ensure that each ordered pair edge is unqiue
  UNIQUE("src", "dst")
);
Inserting a new edge to our DAG model is as simple as wrapping the following template:
INSERT INTO edges (src, dst, ct) -- The (src, dst) ordered pair that you will template in
VALUES
  (?, ?, 1) -- If the (src, dst, ct) edge already exists
  ON CONFLICT (src, dst) DO
UPDATE
  -- Update the count of times that edge has occurred
SET
  ct = ct + 1;
Finally, the deduplicates nodes is just a UNION operation of the two columns.
SELECT
	src AS node
FROM
	edges
UNION
SELECT
	dst
FROM
	edges;
Putting it all together:
--Create
CREATE TABLE IF NOT EXISTS "edges" ( "id" INTEGER, "src" TEXT, "dst" TEXT, "ct" INTEGER, PRIMARY KEY("id" AUTOINCREMENT), UNIQUE("src", "dst") );
--Insert
INSERT INTO edges ( src, dst, ct) VALUES
--Inserted Edges
("a", "b", 1),
("b", "c", 1),
("b", "c", 1)
ON CONFLICT (src, dst) DO UPDATE SET ct = ct + 1;

--List Edges
SELECT * FROM edges;
--List Nodes
SELECT src AS node FROM edges UNION SELECT dst FROM edges;
From just these few SQL snippets, we can easily model a DAG nearly anywhere (including on embedded electronics with very little available memory!)
Reverse Engineering (with a big ol hammer)
As stated before, this blog isn’t about how to use math or algorithms the “right way”. This blog is about building a hammer big enough that everything effectively does become a nail because then you can just SWANG. As reverse engineers, we may be given some data that is completely unknown to us in it’s format. I’ve talked about high level methods to glean information about the Shape of Data for unknown formats.
If you can obtain at least 2, preferably 3+ samples of data, you can generically use a DAG as an easy way to visualize and interact with the unknown data as a graph. Conveiniently, there’s a common type of graph that can graph our graph (ha!). That graph is a Sankey diagrma AKA a “flow chart”.
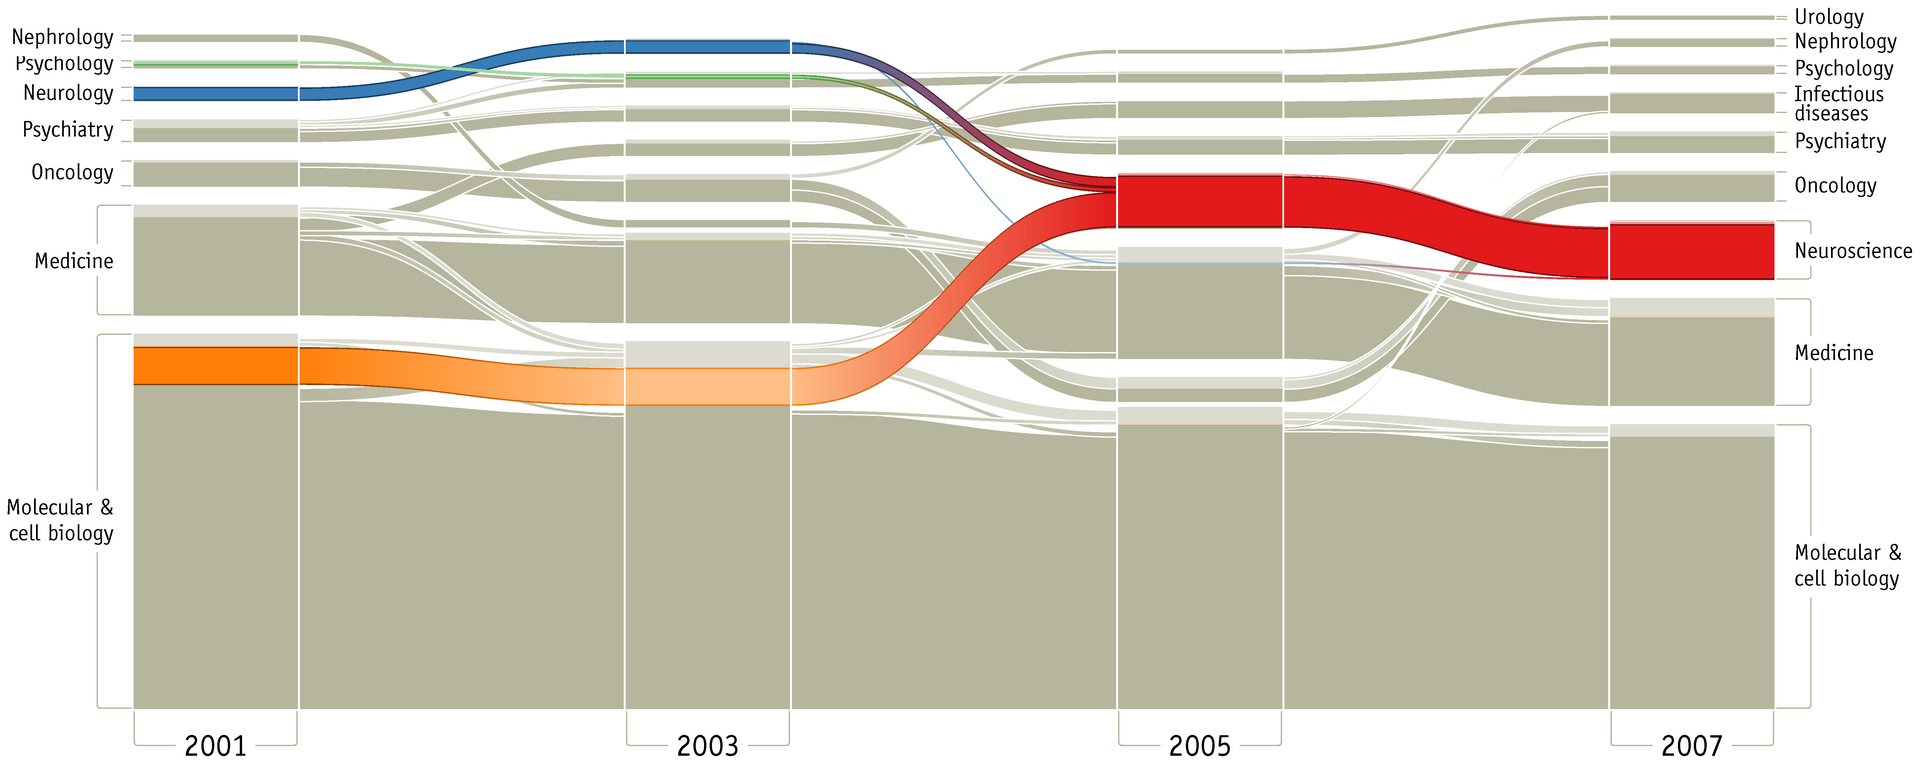
By Martin Rosvall, Carl T. Bergstrom - https://journals.plos.org/plosone/article/figure?id=10.1371/journal.pone.0008694.g003, CC BY 3.0, Link
However, we’ll be making a few tweaks for our generic tooling. Instead of a finite number of buckets for fields of study like “Psychology” or “Nuerology”, we know that a single byte of data will be in a finite number of buckets between 0x00 and 0xff. Notably, if we have 2 streams of data and one is longer than the other, we’d like to transparently pad out the values as NULL.
With this small tweak to support finite buckets of INTEGER of [0-255] or NULL (something a database is quite good at, but a uint8 is bad at), we can pin these byte values at their offset positions within the stream, as well as count the number of incoming and outgoing edges, constrained using database schema tricks.
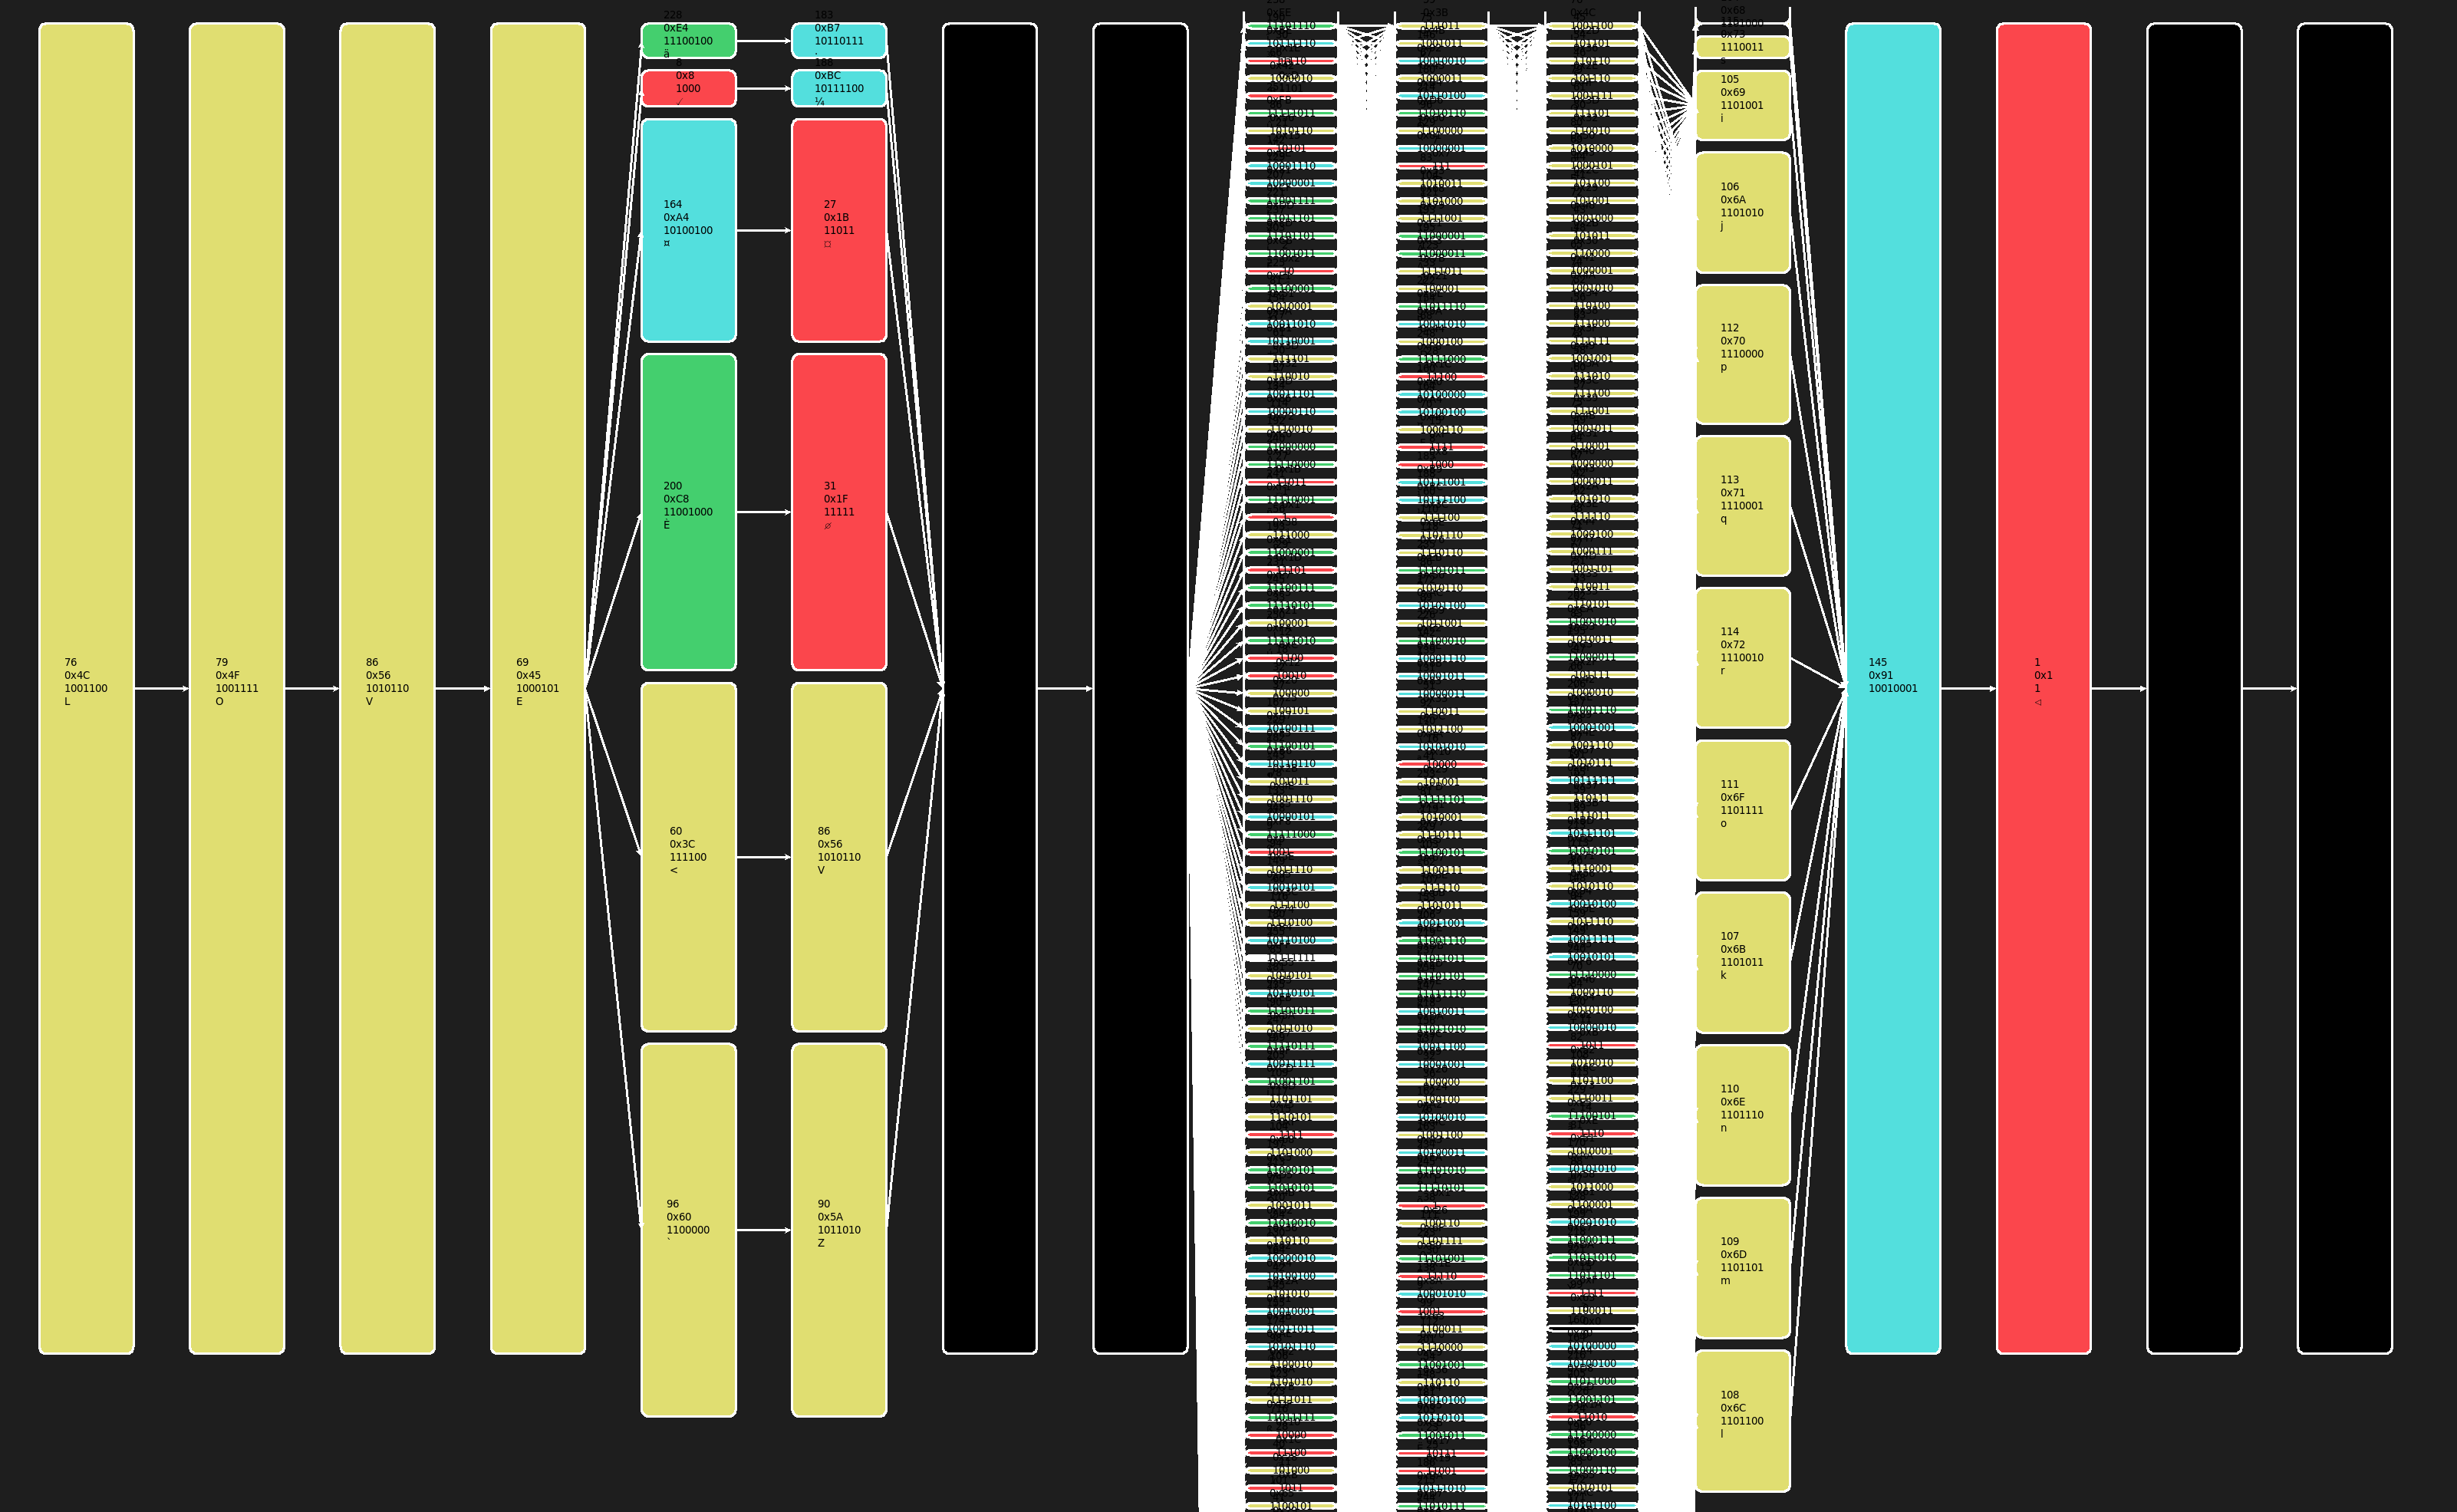
That’s why I wrote Directed Acyclic Graph (DAG) User Interface (UI) Reverse Engineering (RE), pronoucnded “dagger”. It’s all python stdlib. If you have python installed, you’re ready to go. Just echo or cat and pipe in any data you want and it’ll handle the rest. Your mouse scroll wheel and click-and-drag-to-pan allows you to navigate even very large graphs. Additionally, byte value classes are color coded and applied as labels in common representations.
0x00        : Black
0x01 - 0x20 : Red
0x21 - 0x7F : Yellow (ASCII Printable Range)
0x80 - 0xBF : Cyan
0xC0 - 0xFE : Green
0xFF        : White
To do a visual n-way diff of multiple versions of a vendor’s firmware headers to get a better understanding of common structures:
find . -name "vendorXproductYversion*.bin" | python3 daguire.py file 1999
Or, if you happen to have millions of ICMP network packets with an unknown weird payload:
You can simply extract the payload as hex with tshark and pipe it in with hex mode.
tshark -r icmp.pcap -T fields -e data | python3 daguire.py hex 16
This give you a nice representation where you can clearly see the different values, offsets, byte frequencies, and relationships. Here we see a consistent magic header LOVE, followed by 2 uint8 values that share some sort or relationship, 2 bytes of padding, a sequence of 4 bytes that increases in frequency towards the right (likely a monotonically increasing uint32 or 2xuint16) followed by a byte flag, a byte flag, and more padding.
And that’s how you can get pretty close to recovering the structure of a network protocol from millions of packets in just a few seconds.
TODO: Implement an inline python struct editor
Whether it is vendor firmware, network traffic, file formats, etc… it’s all just data. There’s elegant ways to do things the “right” way requiring many tools in your toolbelt. Or you can use graph theory to carry one big ol hammer and get the job done.
Sharing is caring!