BGGP3: Crash on the Cob

For this years Binary Golf Grand Prix I started off by learning to fuzz properly, use a debugger properly, and various tooling. The objective was originally to hit all of the bonus points:
- +1024 pts, if you submit a writeup about your process and details about the crash
- +1024 pts, if the program counter is all 3’s when the program crashes
- +2048 pts, if you hijack execution and print or return “3”
- +4096 pts, if you author a patch for your bug which is merged before the end of the competition
Well, life happens, and I ended up using the majority of my 2 week break from work doing more important things like taking care of my sick infant son (He’s doing much better now).
I learned a ton in the process but I’ll be going after the writeup, authoring a patch, and hijacking execution to print/return “3” in that order.
Behind the scenes, I explored and fuzzed almost a hundred different projects to find one that fit my need and skillset to achieve the most points while still allowing me to grow my skills.
That being said, let’s get a crash on the .cob.
- Side Note: I’m _mattata on Twitter, you should give me a follow. I do stuff like this often.
GnuCOBOL
GnuCOBOL (formerly OpenCOBOL) is a free, modern COBOL compiler. GnuCOBOL implements a substantial part of the COBOL 85, X/Open COBOL and newer ISO COBOL standards (2002, 2014, 2022), as well as many extensions included in other COBOL compilers (IBM COBOL, MicroFocus COBOL, ACUCOBOL-GT and others).
GnuCOBOL translates COBOL into C and internally compiles the translated code using a native C compiler. Build COBOL programs on various platforms, including GNU/Linux, Unix, Mac OS X, and Microsoft Windows. GnuCOBOL has also been built on HP/UX, z/OS, SPARC, RS6000, AS/400, along with other combinations of machines and operating systems.
Common file extensions for COBOL source files are .cob and .cbl. The compiler name is cobc. The GnuCobol compiler toolchain is available on most debian based systems with apt install gnucobol3 with a version of:
cobc (GnuCOBOL) 3.1.2.0
Built     Sep 14 2021 19:23:38
Packaged  Dec 23 2020 12:04:58 UTC
C version "11.2.0"
At the time of writing, the creation and crashing testcases are applicable to this version.
Fuzzing
As mentioned in a previous exploratory blog, I used Docker with Portainer.io to orchestrate containers for fuzzing which allowed me to manage fuzzing containers from a web interface on my phone (super useful when your child is asleep on top of you).
The fuzzer used to find this crash was Honggfuzz which comes with a handy Dockerfile. This allowed me to have a clean slate with all fuzzing instrumentation built in that I could simply pull/build projects on top of it for fuzzing purposes.
When docker auto assigned a name to the container, I knew I was gonna have good luck with fuzzing.

Before starting the fuzzing session, I disabled ASLR on the host as that is needed to help honggfuzz determine if a crash is unique from others.
echo 0 | tee /proc/sys/kernel/randomize_va_space
Building the GnuCobol compiler with the provided honggfuzz instrumentation was trivial and simply required installing a few required libraries and performing:
CC=/honggfuzz/hfuzz_cc/hfuzz-gcc CXX=/honggfuzz/hfuzz_cc/hfuzz-g++ ./configure --enable-debug
make -j$(nproc)
make install
ldconfig
cobc -h
--enable-debug is not technically necessary, but I wanted to easily debug things relative to the available source code since I’m not very good with GDB yet.
Usage: cobc [options]… file…
For cobc a minimal set of parameters to compile a file looks like:
cobc -o out.elf in.cob
For honggfuzz, a minimal set of parameters to fuzz a binary with instrumentation looks like:
honggfuzz -i input_dir -z -- instrumented.elf ___FILE___
where ___FILE___ is the mutated input file produced by the fuzzer that )hopefully) triggers unexpected behavior in the compiler.
In practice, we combine these two to form our commands to fuzz cobc with honggfuzz
honggfuzz -n16 -i /in/ -z -- /usr/local/bin/cobc -o /dev/null ___FILE___
-n16runs honggfuzz with 16 threads which increases throughput due to timeouts/in/our corpus of fuzzing input/usr/local/bin/cobcabsolute path to our target binary for fuzzing-o /dev/nulldiscard successfully compiled input in a concurrent safe manner
Now we just need some Cobol source code samples! So being lazy, I just grabbed one from the IBM site https://www.ibm.com/docs/en/zos/2.1.0?topic=routines-sample-cobol-program and dropped it in /in/.
Most testcases resulted in timeouts resulting in an average of ~200 tests per second, but after a few hours I had a handful of crashes to work with.
Minimizing
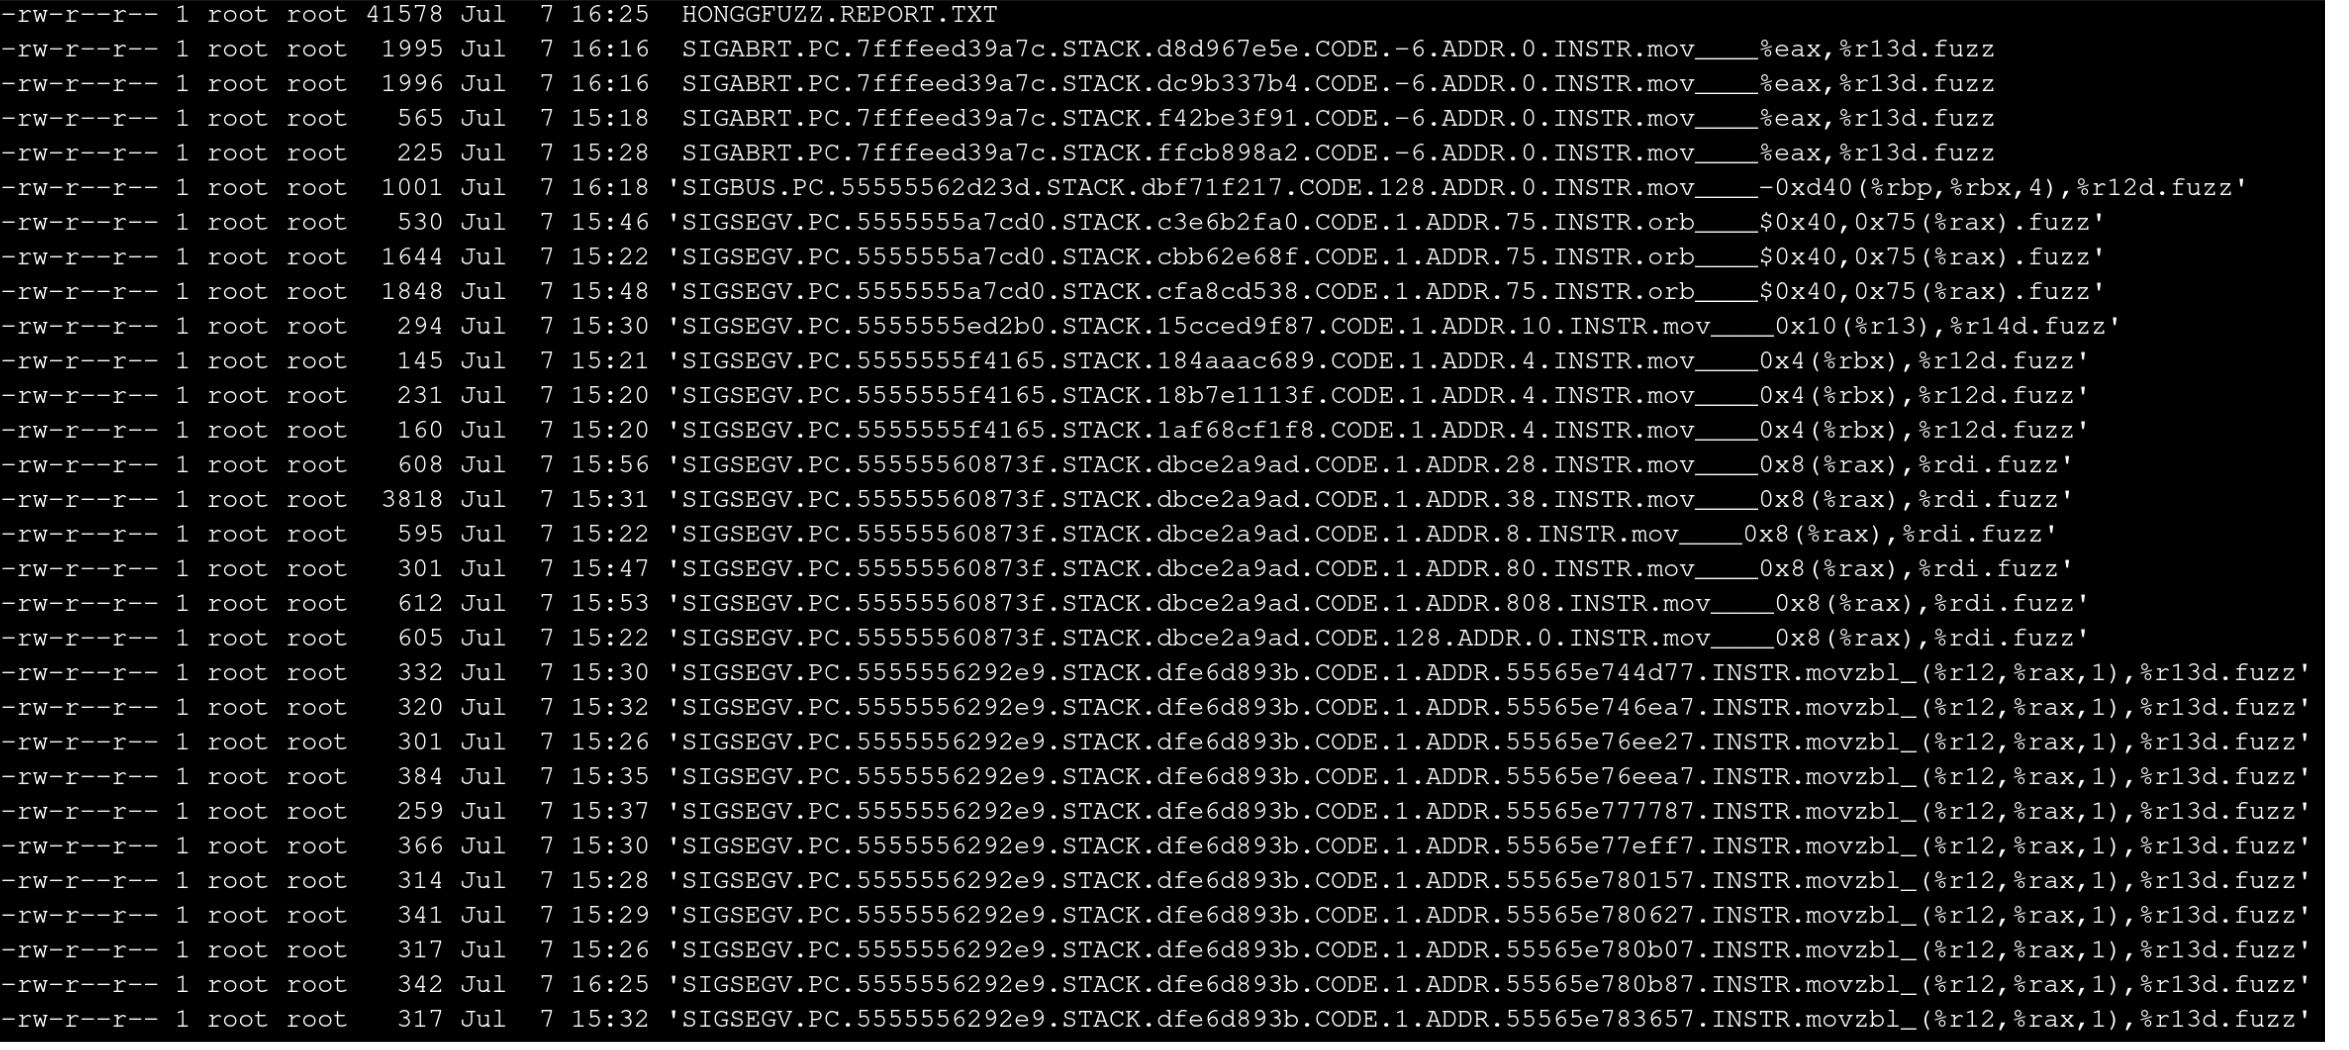
I explored all crashes, but was particualrly interested in the SIGABRT crashes. Unfortunately they were much larger than preferred (225-1996 bytes) which would make determining what specific part of the file caused the crash. I resolved to write a small testcase minifier.
The filenames that hongfuzz gives it’s crashing testcases are useful for a number of reasons, but for this use I’m interested in the .CODE.-6 part. This represents the exit code that was returned upon the crash and is something we can trivially check for.
import os
from subprocess import run

TESTCASE = None
TESTCASE_SZ = 0
CHOP_BLOCK_SIZE = 1
COMMAND = ['/usr/local/bin/cobc', '-o', '/dev/null', '___FILE___']

def createFile(contents):
    fd = os.memfd_create('contents')
    os.write(fd, contents)
    pid = os.getpid()
    return {
        "pid": pid,
        "fd": fd
    }

def closeFile(fd):
    os.close(fd)

def runCommand(cmd, memfd_obj):
    tempCmd = cmd
    fd_path = '/proc/' + str(memfd_obj['pid']) + '/fd/' + str(memfd_obj['fd'])
    tempCmd[-1] = fd_path
    p = run(tempCmd)
    #Check whether exit code is still the same as the desired crash
    if p.returncode != -6:
        return False
    else:
        return True

# Trims 1 byte off the end of bytes()
def reduce_b2f(payload):
    return payload[:-1]

# Removes a section of bytes() from the middle of the input of CHOP_BLOCK_SIZE
def reduce_chopper(index, payload):
    return payload[:index] + payload[index+CHOP_BLOCK_SIZE:]

def main():
    #Read testcase into variable
    with open('crash.cob', 'rb') as f:
        TESTCASE = f.read()
    TESTCASE_SZ = len(TESTCASE)
    #Reduce back-to-front
    for i in range(TESTCASE_SZ):
        #Chop a byte off the end
        reduced = reduce_b2f(TESTCASE)
        #Create an in-memory file descriptor
        memfdObj = createFile(reduced)
        #Check if it still crashes
        didCrash = runCommand(COMMAND, memfdObj)
        #Close fd
        closeFile(memfdObj['fd'])
        if didCrash:
            TESTCASE = reduced
            print(TESTCASE)
            with open('minimal.cob', 'wb') as f:
                f.write(TESTCASE)

    #reset size counter
    TESTCASE_SZ = len(TESTCASE)

    #Reduce front-to-back
    for i in range(TESTCASE_SZ-CHOP_BLOCK_SIZE):
        #Chop a byte off the end
        reduced = reduce_chopper(TESTCASE)
        #Create an in-memory file descriptor
        memfdObj = createFile(reduced)
        #Check if it still crashes
        didCrash = runCommand(COMMAND, memfdObj)
        #Close fd
        closeFile(memfdObj['fd'])
        if didCrash:
            TESTCASE = reduced
            with open('minimal.cob', 'wb') as f:
                f.write(TESTCASE)
    print('Done.')

main()
The above code is fairly self descriptive with the exception of the memfd_create calls. I thought that I might have a usecase for minimizing a lot of testcases in bulk, but didn’t end up ever using that functionality.
At it’s core this script:
- Chops bytes off the end of the file and checks if it still crashes
- Chops byte out of the middle of the file of size
CHOP_BLOCK_SIZEand checks if it still crashes
Originally I was testing this script on the 1996 byte testcase and it ended up being the one I chose for a target because it minimized so easily.
It took a few runs and fiddling with incrementally larger CHOP_BLOCK_SIZE, but eventually I ended up with:
00000000: 0922 59dc 45ec 8ab3 7259 25f1 b184 8115  ."Y.E...rY%.....
00000010: 0db0 5d20 4449 4e47 030d 49e7 a3bd 3928  ..] DING..I...9(
00000020: 5553 ab45 5245 4d00                      US.EREM.
root@476d2db17e6e:/cobolfuzz/shortname# cobc -o /dev/null abrt.cob
abrt.cob:1: warning: line not terminated by a newline [-Wothers]
I磽9(USEREM ...'r: invalid literal: 'YE슳rY%
abrt.cob:1: error: missing terminating " character
*** stack smashing detected ***: terminated
Aborted (core dumped)
Neat.
Debugging
During the process of debugging and determining the underlying cause of the crash I got familiar with tools such as gdb, gef, exploitable, and libSanitizer. Please bear with me as this section of the writeup may be overly verbose for people already familiar with gdb, but I’m writing it as a detailed set of notes for later.
But first, the compiler itself provides fairly detailed error messages itself. We can rebuild cobc with the stack protector disabled and diff the messaging to get a high level hint.
./configure CFLAGS="-fno-stack-protector" COB_CFLAGS="-fno-stack-protector" --enable-debug
Re-running the testcase now produces:
root@6d6a31982a66:/# cobc -o /dev/null abrt.cob
abrt.cob:1: warning: line not terminated by a newline [-Wothers]
I磽9(USEREM ...'r: invalid literal: 'YE슳rY%
abrt.cob:1: error: missing terminating " character
abrt.cob:1: error: PROGRAM-ID header missing
abrt.cob:1: error: PROCEDURE DIVISION header missing
abrt.cob:1: error: syntax error, unexpected Literal
Diff
4,5c4,6
< *** stack smashing detected ***: terminated
< Aborted (core dumped)
\ No newline at end of file
---
> abrt.cob:1: error: PROGRAM-ID header missing
> abrt.cob:1: error: PROCEDURE DIVISION header missing
> abrt.cob:1: error: syntax error, unexpected Literal
\ No newline at end of file
This gives me a hint to look for code in the program flow between error: missing terminating " character and error: PROGRAM-ID header missing
Additional tools such as gdb with gef and exploitable are useful.
GDBcan be installed via apt.GEFcan be installed viabash -c "$(curl -fsSL https://gef.blah.cat/sh)"exploitablecan be installed viagit clone https://github.com/jfoote/exploitable.git && cd exploitable && python3 setup.py install
Launching gdb against cobc with stack prtoector enabled with the commands
gdb cobc
> run -o /dev/null abrt.cob
> exploitable
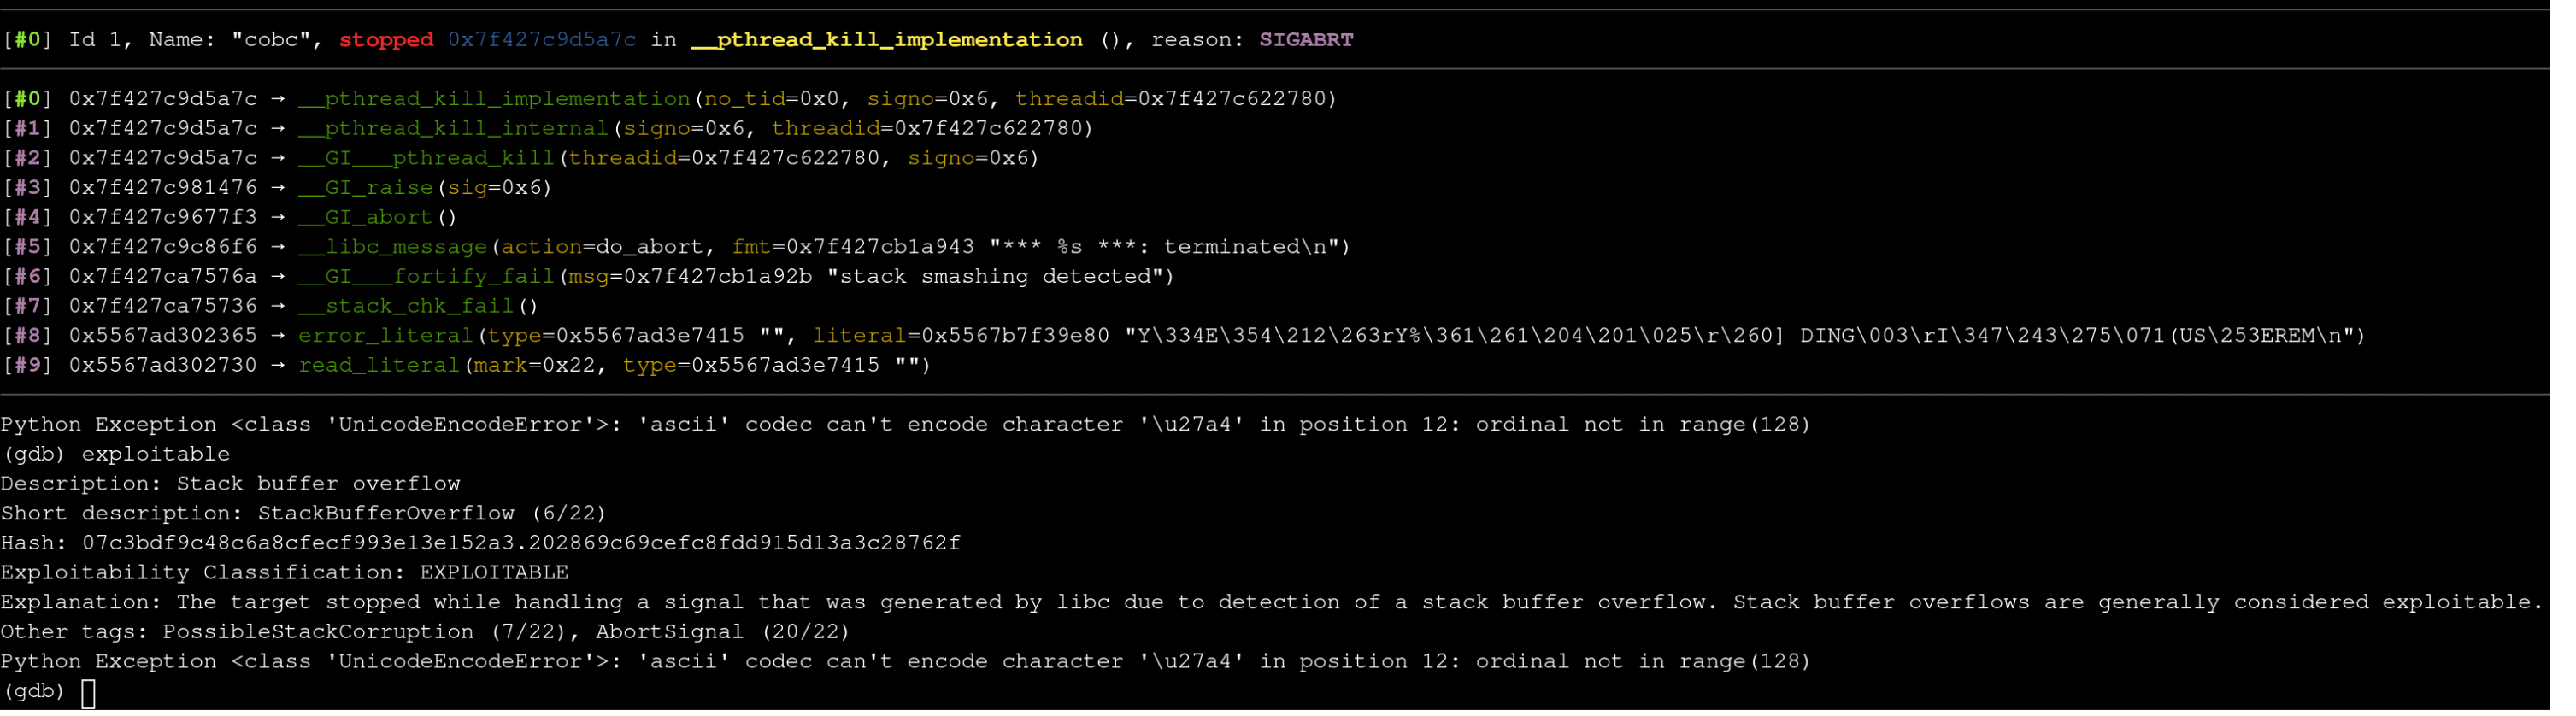
By typing the where command into gdb we can see the lines in which these functions are called in the traceback. We can see that the 2 most recently called functions before failing the stack check are:
- error_literal
/gnucobol-3.1.2/cobc/scanner.l:1214 - read_literal
/gnucobol-3.1.2/cobc/scanner.l:1271
(gdb traces are read top-down)
Looking at the source code for error_literal, we can see that L1214 is the end of the function.
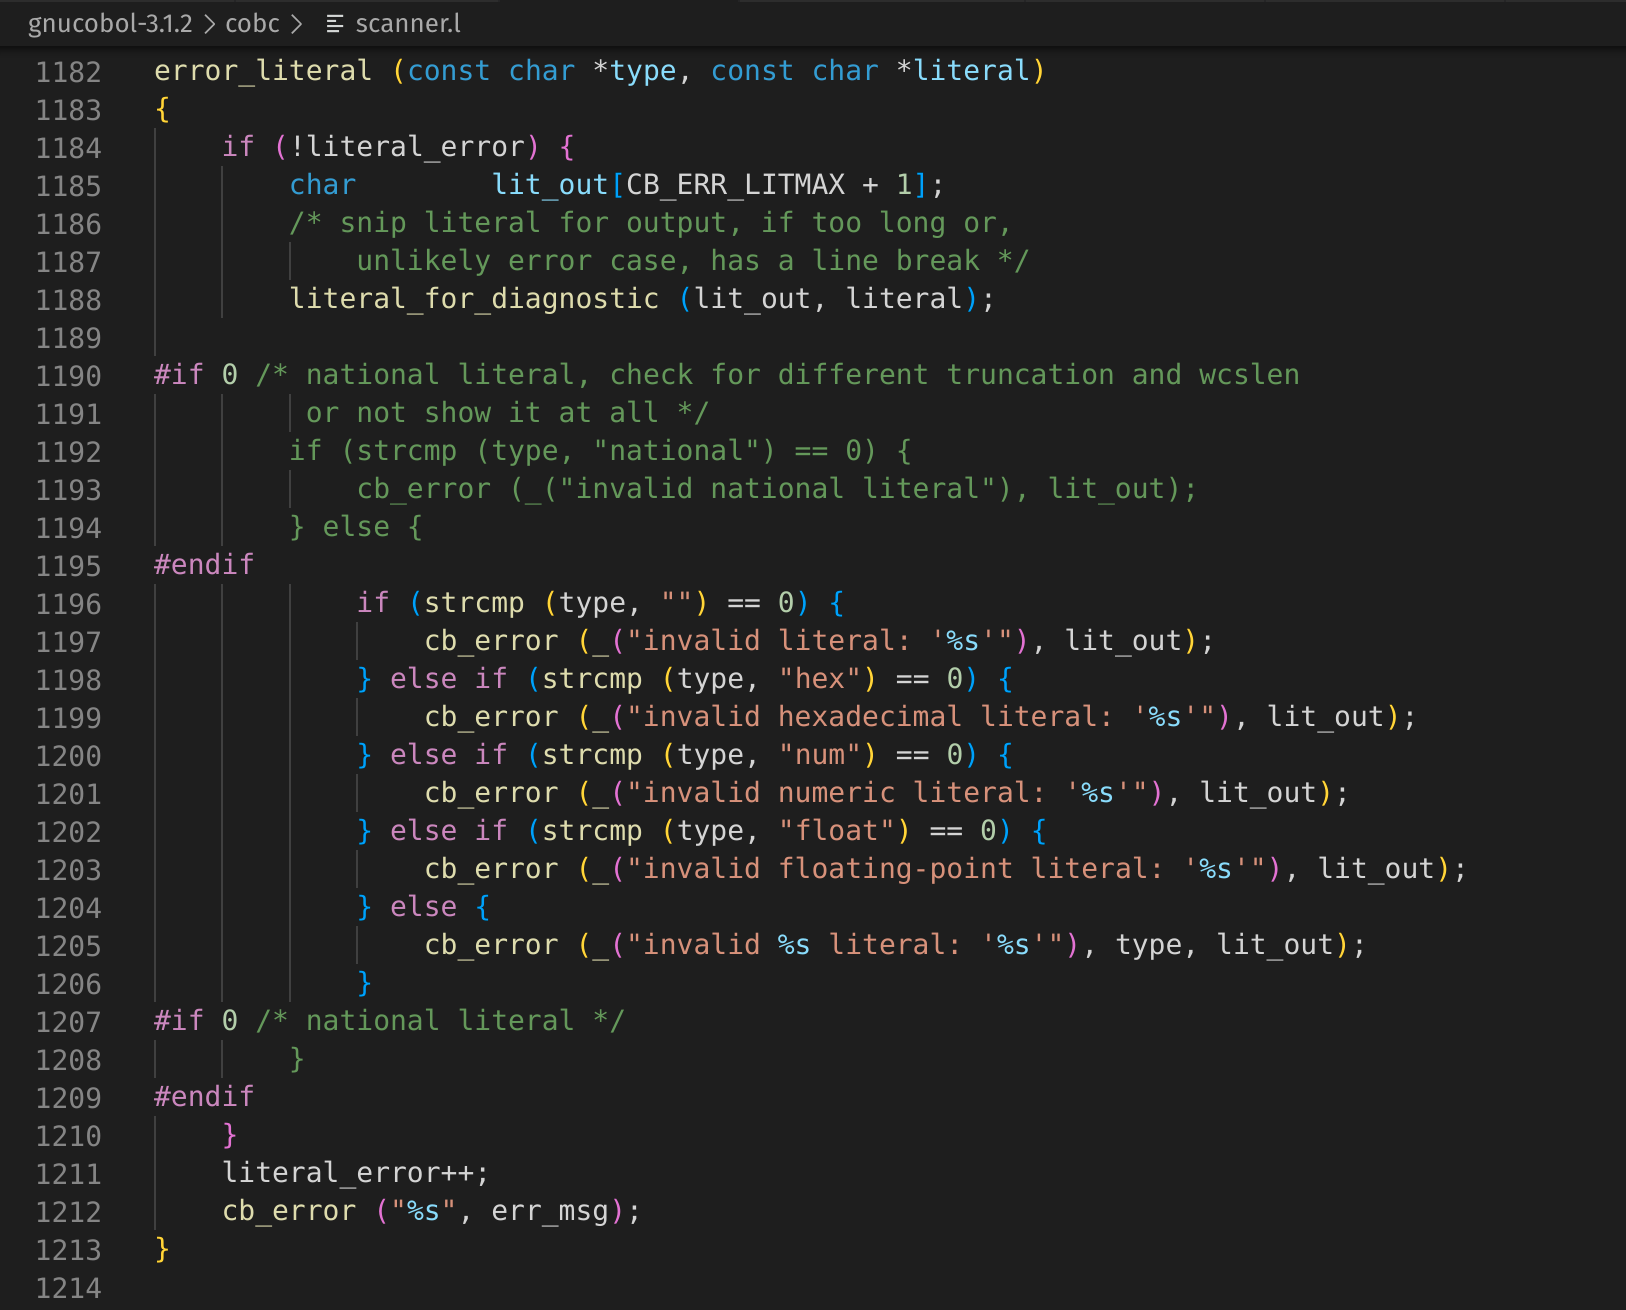
Let’s set a breakpoint on some interesting lines within this function such as L1212 and peek at what err_msg contains.
cb_error ("%s", err_msg);
This can be done by issuing the gdb commands:
gdb cobc
> break scanner.l:1212
> run -o /dev/null abrt.cob
The breakpoint will hit and we can view the contents of err_msg by typing
print err_msg
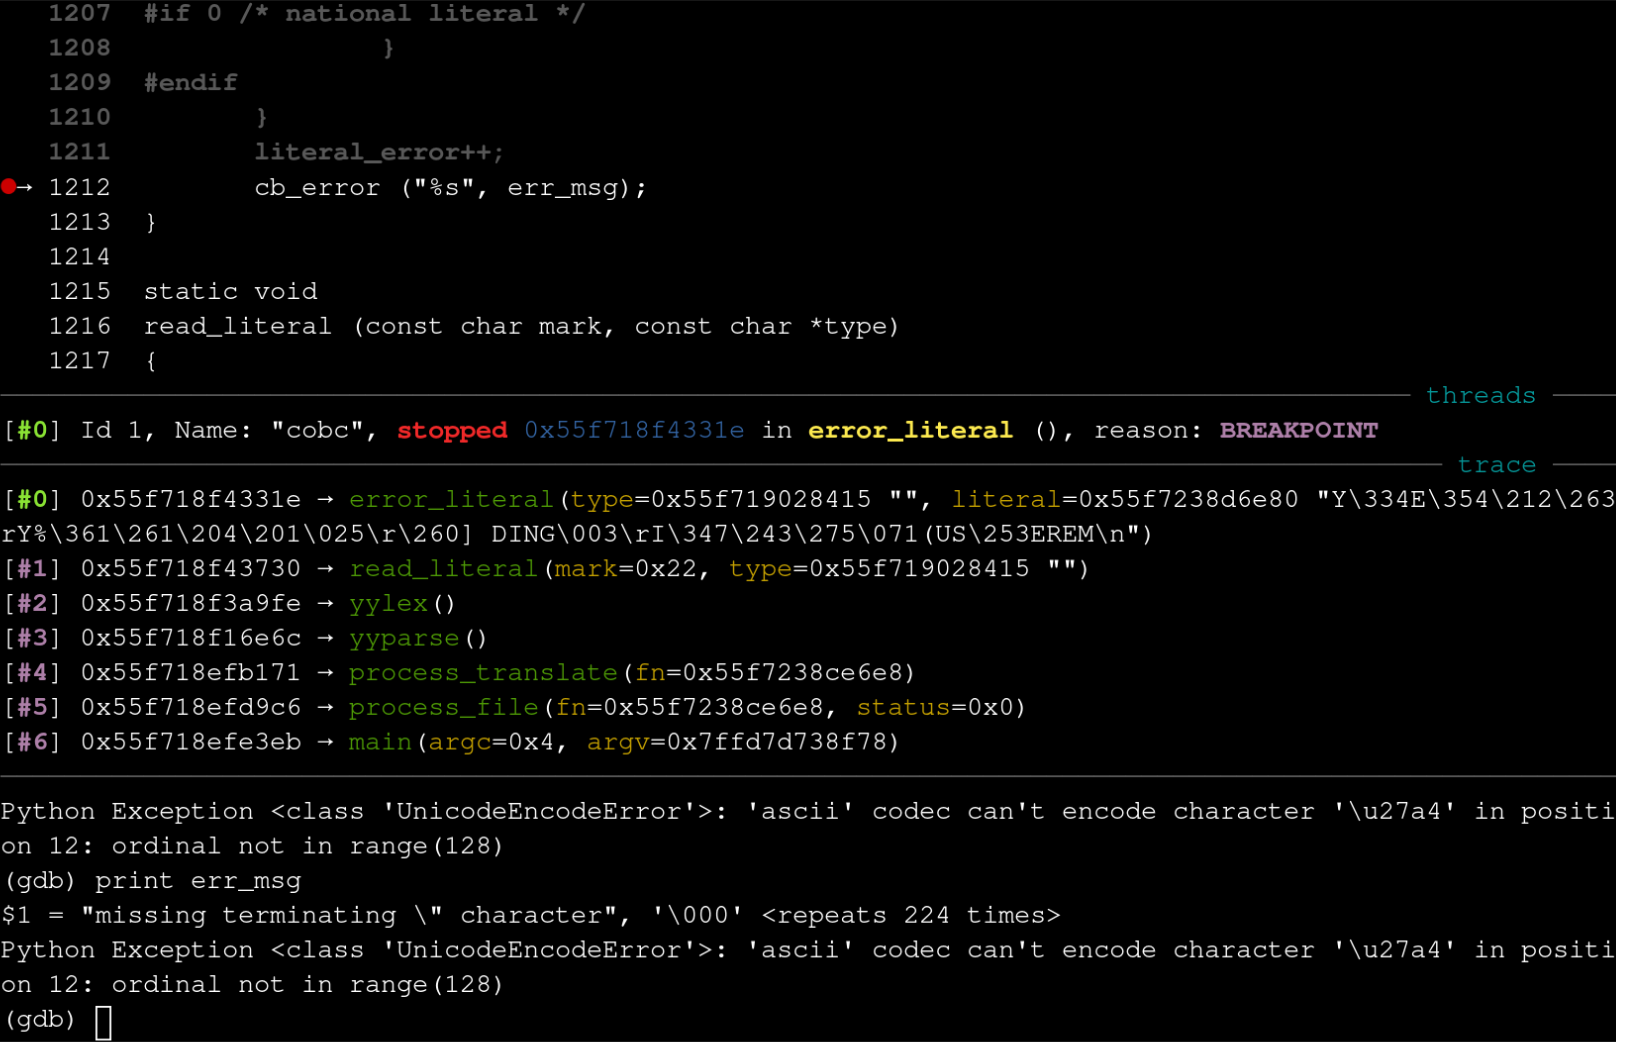
We can see that the two parameters are:
$1 = "missing terminating \" character", '\000' <repeats 224 times>
This definitely doesn’t look right. And by typing next into gdb, we see that the stack protector kicks in with a SIGABRT directly after this function call. With some peeking at the source code we can see:
scanner.l:155:
static char err_msg[COB_MINI_BUFF];
common.h:621:
#define COB_MINI_BUFF 256
This definitely seems like a problematic area, but I’m unsure if the actual problem is higher up in the code. I don’t know much about how the stack protector works, but I assume it doesn’t check constantly for performance reasons. This means the stack check failure may trigger at the end of the function even though something higher up in the code is responsible for the bug. Knowing literally this much about it, I assume it’s meant to be more of a canary than a debugging tool.
I did some reading on libSanitizer which seems a bit more specialized for this task and changed the build steps of cobc to use it.
./configure \
CFLAGS="-fsanitize=address -fno-omit-frame-pointer" \
COB_CFLAGS="-fsanitize=address -fno-omit-frame-pointer" \
--enable-debug
Re-running the testcase without gdb results in:
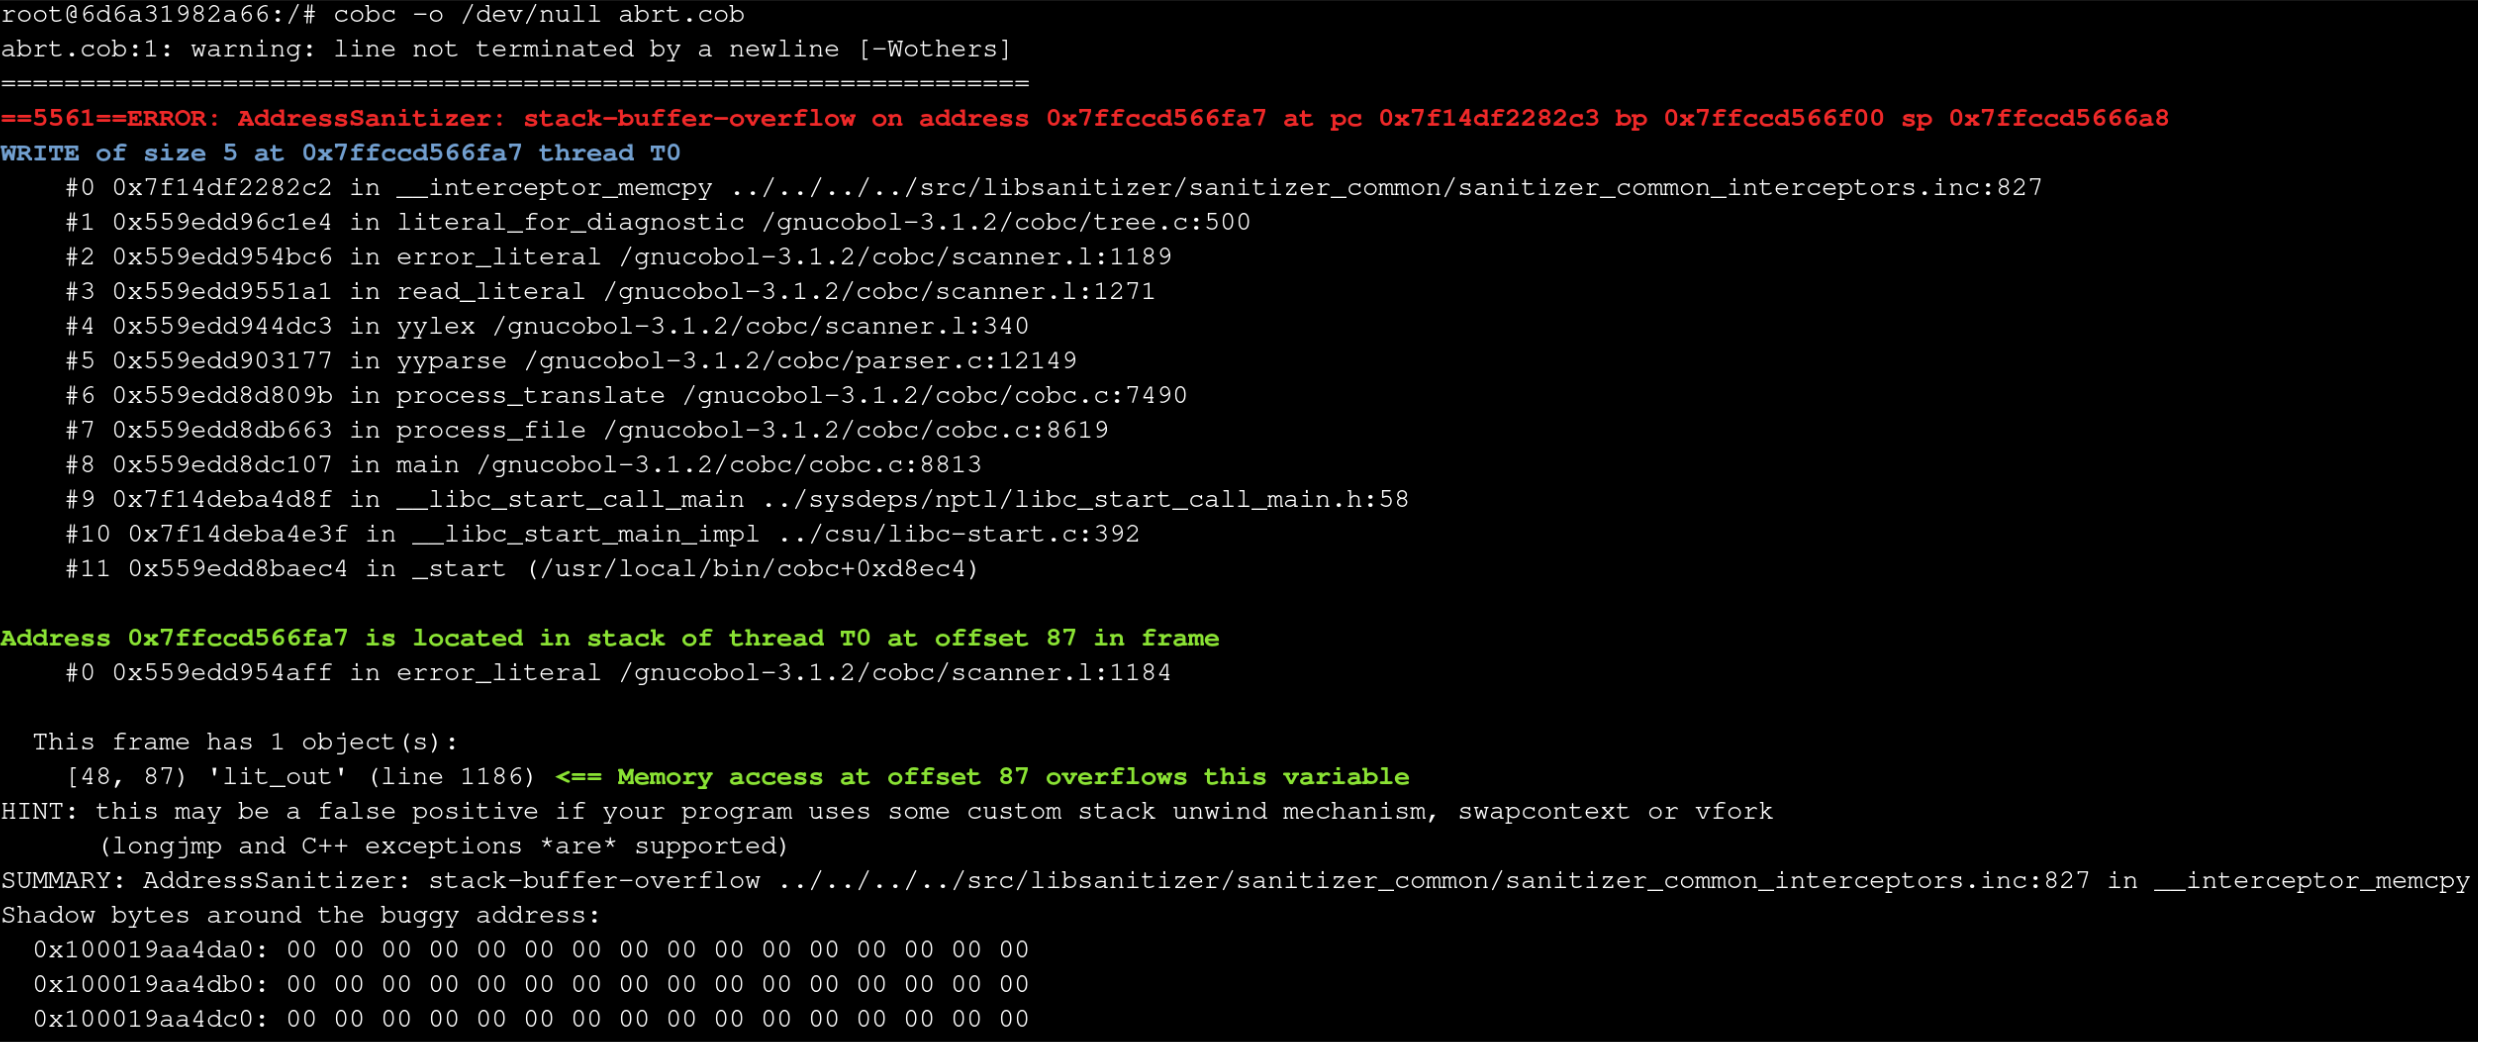
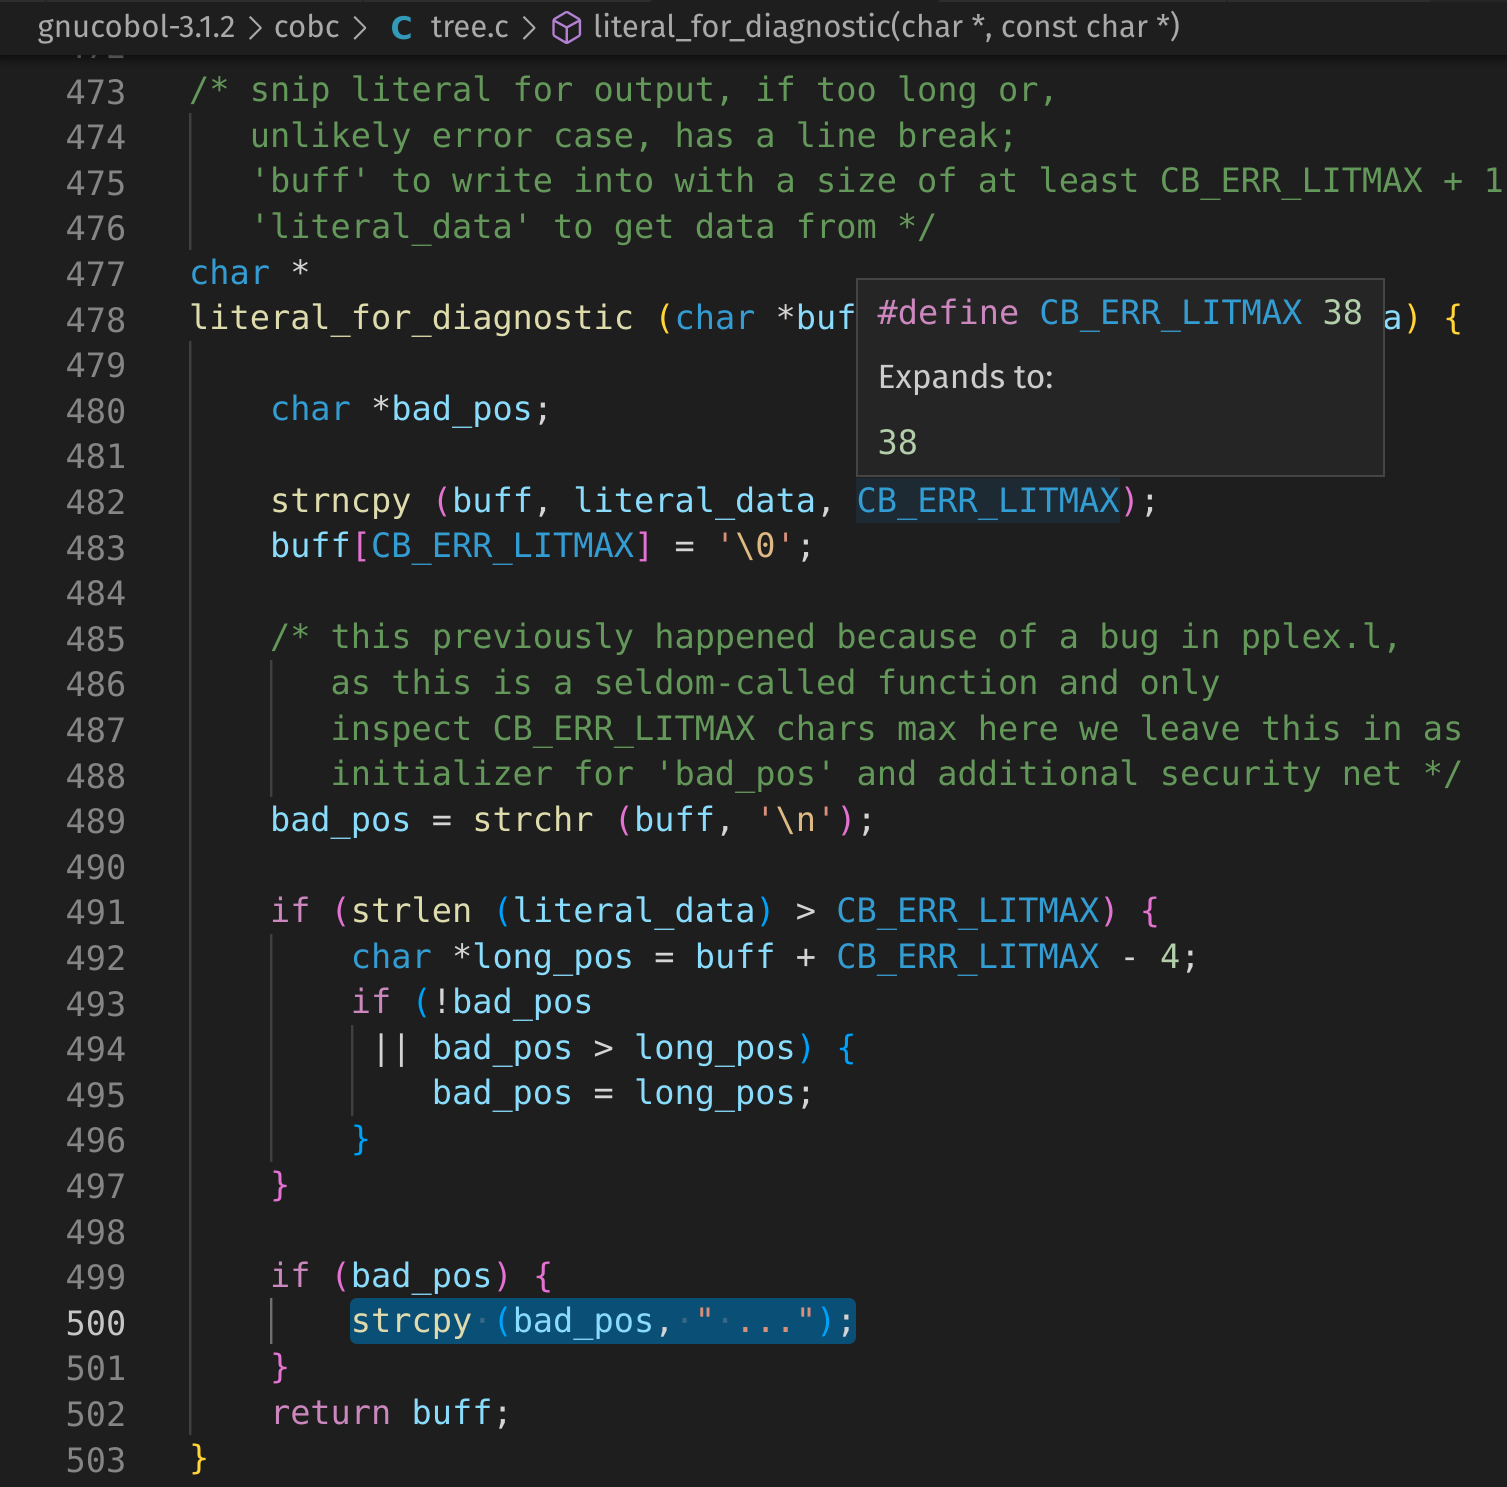
This seems to indicate that there is a 5-byte stack buffer overflow but the trace points to a different line than before (L1189) as well as pointing to a new function at the top of the trace literal_for_diagnostic.
#1 0x5555556de1e4 in literal_for_diagnostic /gnucobol-3.1.2/cobc/tree.c:500
#2 0x5555556c6bc6 in error_literal /gnucobol-3.1.2/cobc/scanner.l:1189
tree.c
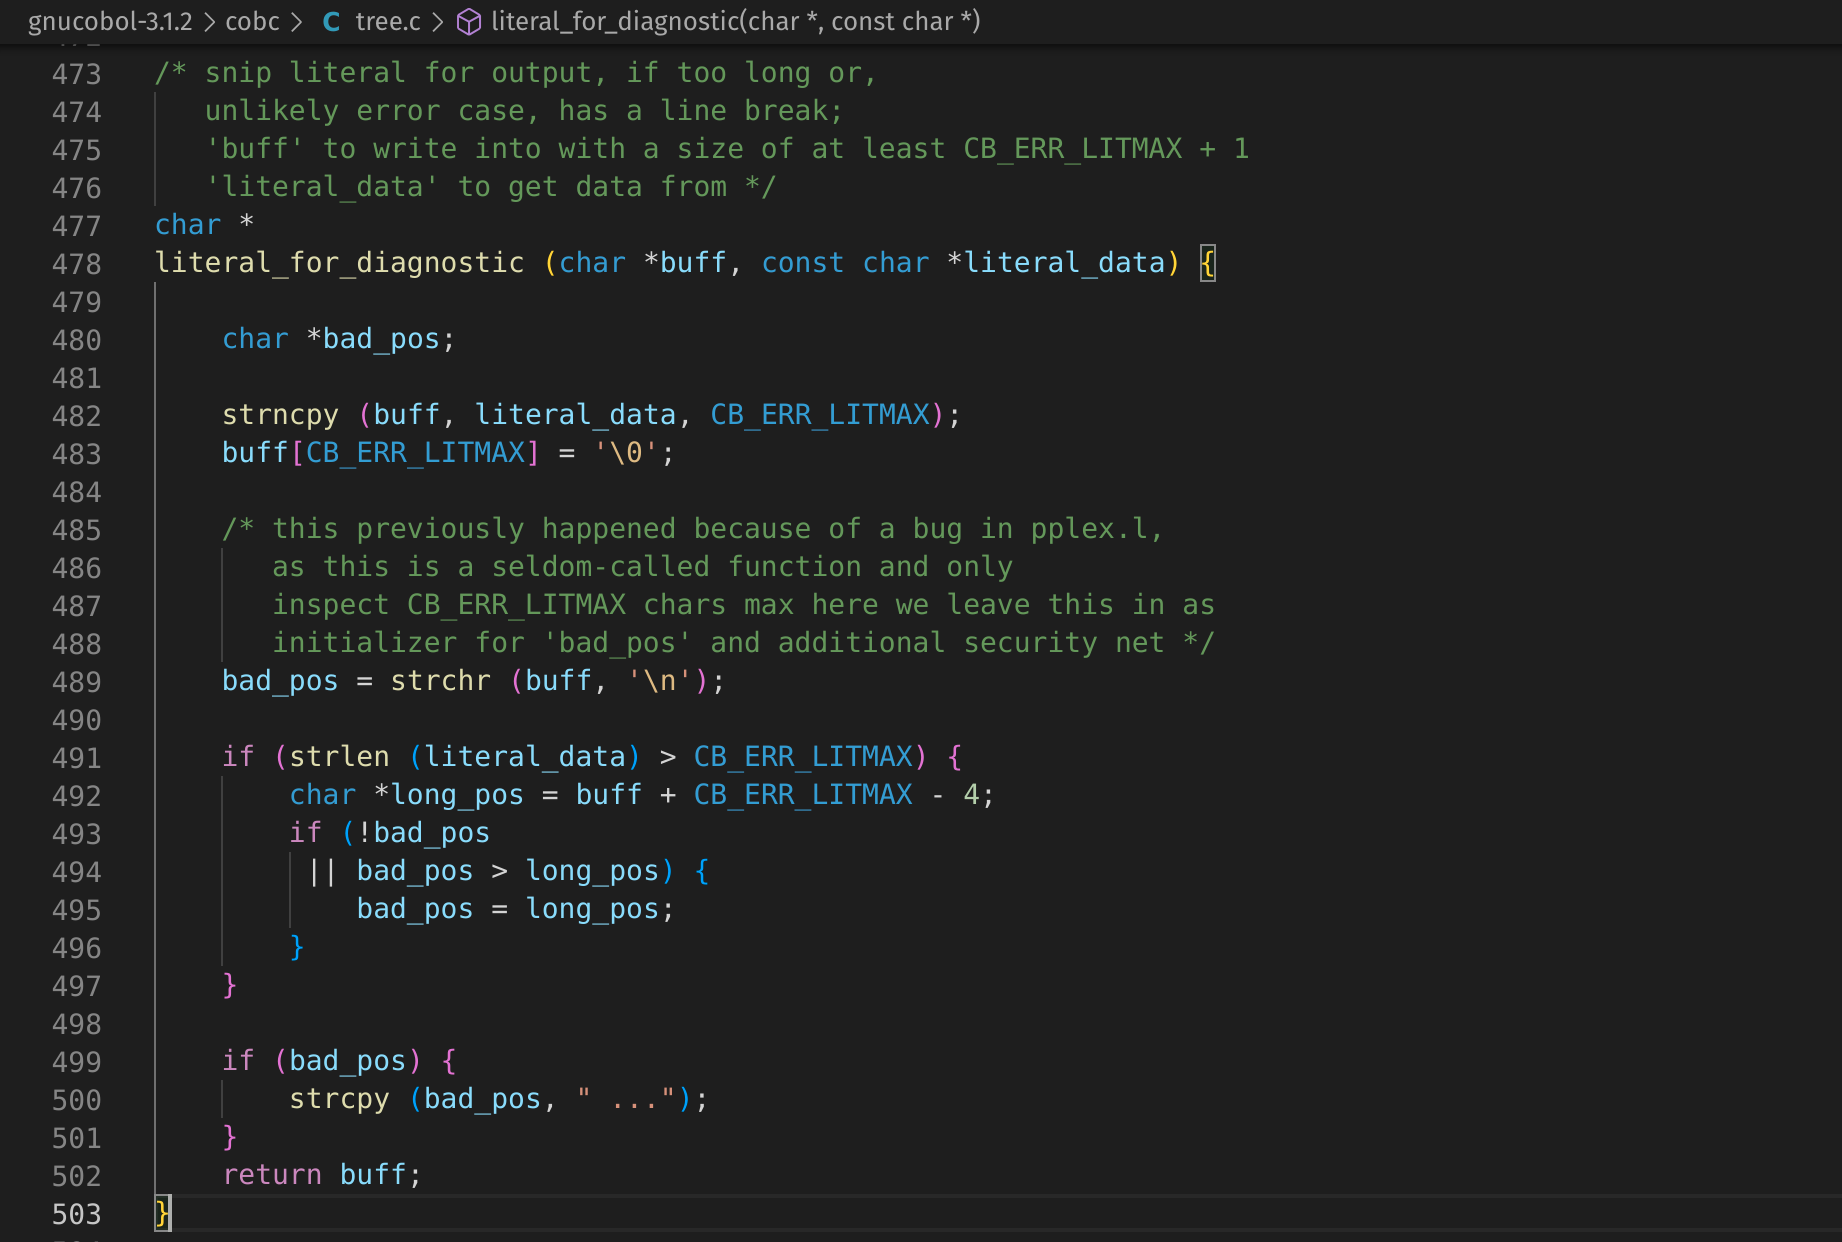
Let’s re-run the libSanitizer build of cobc and set a breakpoint at the top of the function with break tree.c:478 in gdb, then step through it with next (shorthand n).
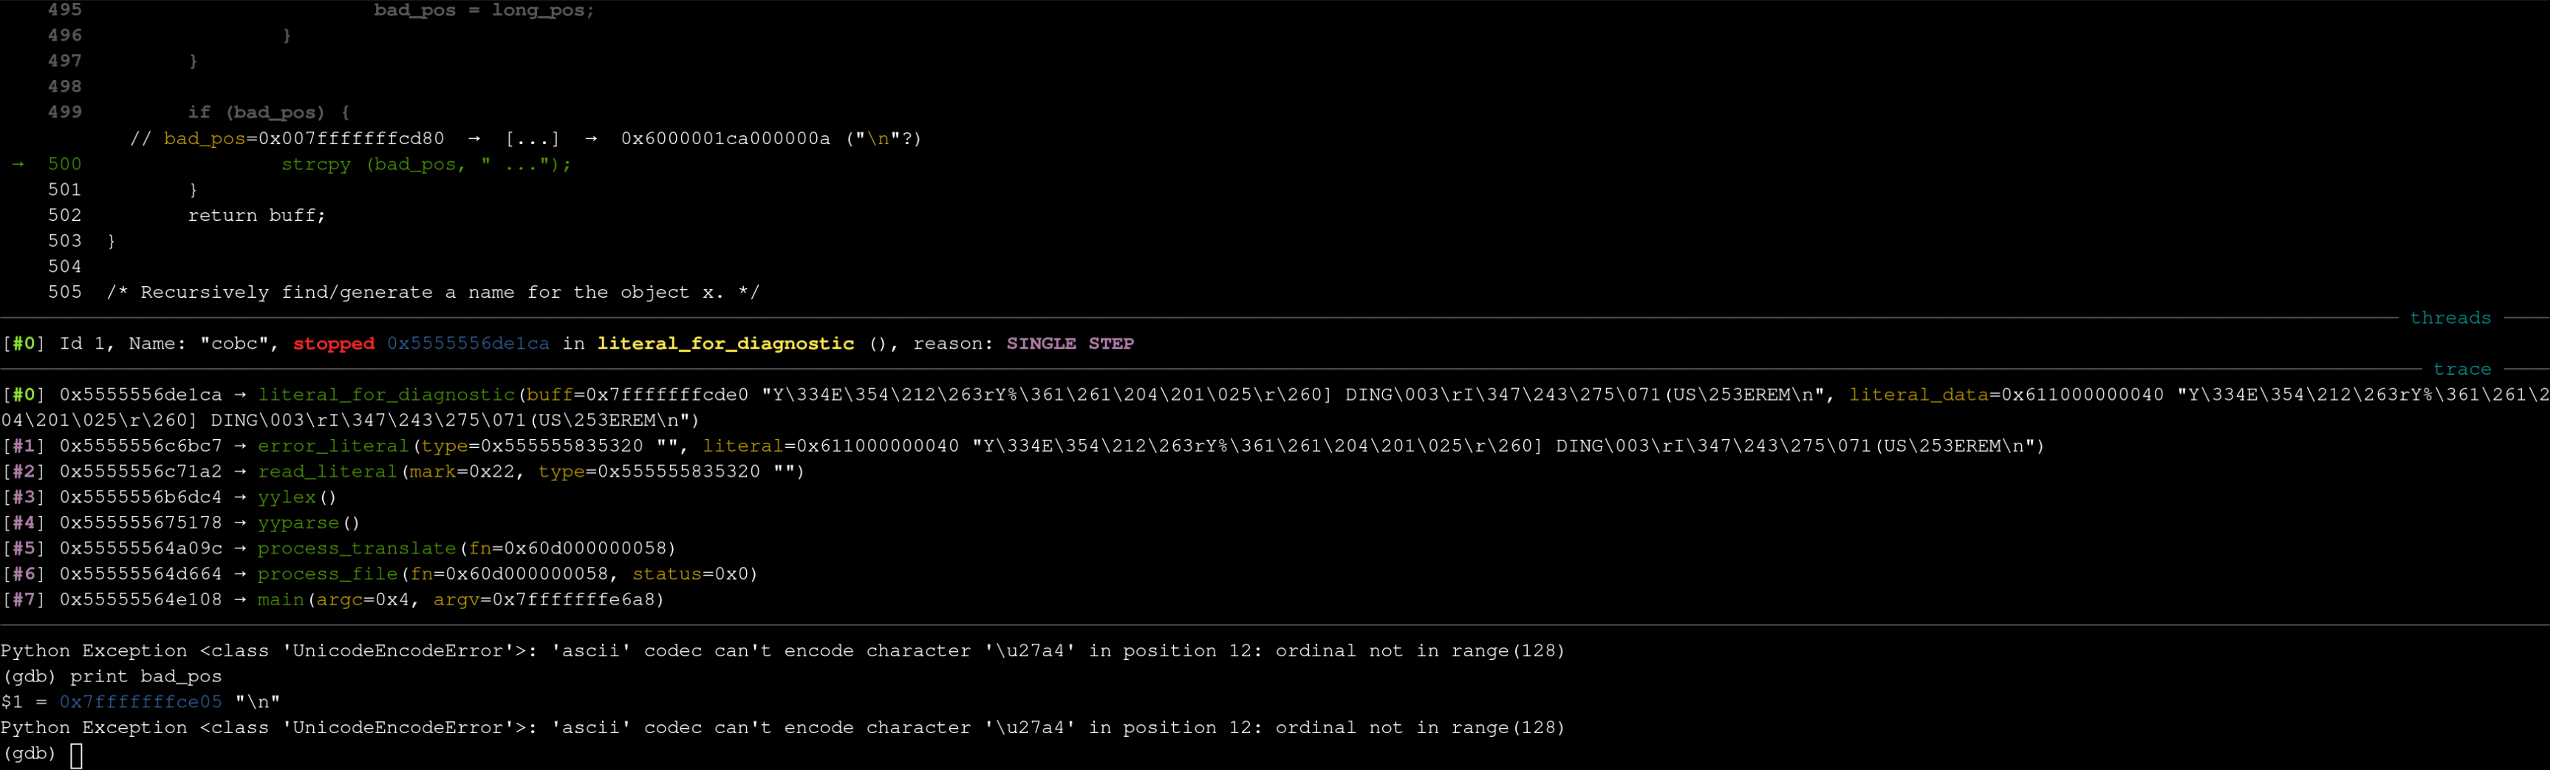
This is the last line run before libSanitizer kicks in.
We can see by calling print bad_pos in gdb that bad_pos is a pointer to an area of memory containing \n.
This effectively makes tree.c:500:
strcpy ("\n", " ...");
A quick lookup of the functionality of strcopy shows:
char * strcpy ( char * destination, const char * source );
Copies the C string pointed by source into the array pointed by destination, including the terminating null character (and stopping at that point).
To avoid overflows, the size of the array pointed by destination shall be long enough to contain the same C string as source (including the terminating null character), and should not overlap in memory with source.
Well, this definitely appears to be the 5-byte stack buffer overflow libSanitizer spotted. Unfortunately, the source copied to the destination is hardcoded as " ..." which significantly hampers what we’re able to leverage this for use.
However, this still means that we can trigger a bug and have some level of control over the code between literal_for_diagnostic (where the bug is) and cb_error (where the stack protector kicks in on a default build causing the crash). Conveniently, this section of code is also close to the code which writes an error to STDOUT so we may still get some bonus points.
static void
error_literal (const char *type, const char *literal)
{
	if (!literal_error) {
		char		lit_out[CB_ERR_LITMAX + 1];
		/* snip literal for output, if too long or,
			unlikely error case, has a line break */
		literal_for_diagnostic (lit_out, literal);

#if 0 /* national literal, check for different truncation and wcslen
		 or not show it at all */
		if (strcmp (type, "national") == 0) {
			cb_error (_("invalid national literal"), lit_out);
		} else {
#endif
			if (strcmp (type, "") == 0) {
				cb_error (_("invalid literal: '%s'"), lit_out);
			} else if (strcmp (type, "hex") == 0) {
				cb_error (_("invalid hexadecimal literal: '%s'"), lit_out);
			} else if (strcmp (type, "num") == 0) {
				cb_error (_("invalid numeric literal: '%s'"), lit_out);
			} else if (strcmp (type, "float") == 0) {
				cb_error (_("invalid floating-point literal: '%s'"), lit_out);
			} else {
				cb_error (_("invalid %s literal: '%s'"), type, lit_out);
			}
#if 0 /* national literal */
		}
#endif
	}
	literal_error++;
	cb_error ("%s", err_msg);
}
Tweaking Testcase
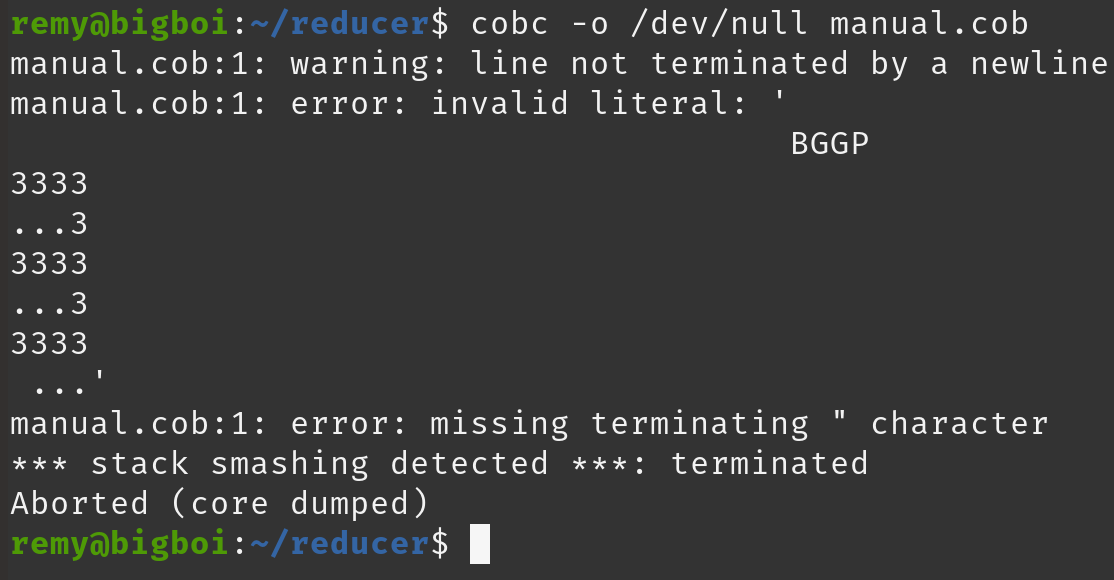
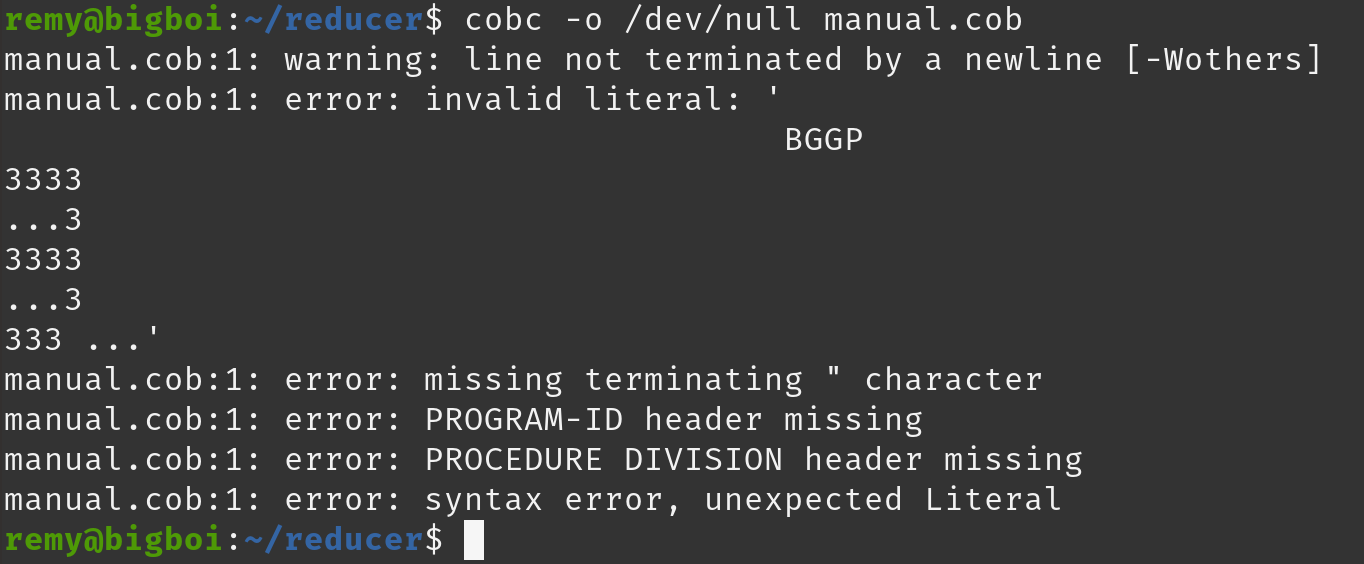
I want to tweak different pieces of my testcase manually to observe different behaviors.
A useful script that can be run in a bash shell uses inotify from the inotify-tools package. This one-liner watches for changes made to a file from a GUI hex editor and automatically re-runs the testcase.
while inotifywait -e close_write manual.cob; do cobc -o /dev/null manual.cob; echo "========" done
Eventually I end up with:
00000000: 0922 0b42 4747 50c2 8533 3333 33c2 852e  .".BGGP..3333...
00000010: 2e2e 33c2 8533 3333 33c2 852e 2e2e 33c2  ..3..3333.....3.
00000020: 8533 3333 33c2 8500                      .3333...
0x09- Character Tabulation
- Just enough to start the parser for a literal
0x22"
- Start a literal
0xC2, 0x85interspersed with ASCII- Next Line (NEL)
- Used to manipulate the STDOUT without using a
\nwhich would prevent the crash
- Used to manipulate the STDOUT without using a
0x00- NULL
- A NULL must occur exactly 38 bytes after the starting
"of literal for crash to occur
- A NULL must occur exactly 38 bytes after the starting
Writing a Patch
As hinted above, a NULL 0x00 must occur exactly 38 bytes after the start of a cobol literal. This is due to:
#define CB_ERR_LITMAX 38
If the NULL occurs 37 bytes after the start of the literal, there is no crash.
If the NULL occurs 39 bytes after the start of the literal, there is no crash.
This section correctly handles everything correctly EXCEPT a strlen of 38.
if (strlen (literal_data) > CB_ERR_LITMAX) {
If we add a single character “=”, we should no longer see a crash.
if (strlen (literal_data) >= CB_ERR_LITMAX) {
Nice.
Submitting A Patch
GnuCOBOL is hosted a SourceForge at https://sourceforge.net/p/gnucobol/. After doing a bit of reading on their project and ticketing structure and relevant tags, I wrote a bug report similar to previous stack based overflow bugs that had been reported in the past including my recommended fix since as a brand new sourceforge user I had no commit access.
It was reviewed and merged within 9 hours.
Commit here: https://sourceforge.net/p/gnucobol/code/4656/
Summary
A Dockerfile and companion crashing testcase is available at:
From the gnucobol folder, simply run:
docker build -t "gnucobol:Dockerfile" .
Let’s tally some points!
crash.on.the.cob is 40 bytes in size and it literally cannot be made any smaller.
- Base Score: 4096 - 40 = 4056
- Writeup: 4056 + 1024 = 5080
- Author a Patch which is merged: 5080 + 4096 = 9176
- Hijack Execution and print or return: 9176 + 😑 = 9176😑
While I had a some fun showing that I could trigger a seldom used function in an error condition and making an ASCII ‘3’ out of 3’s demonstrating control of the output, this doesn’t qualify as “Hijacking Execution”. Maybe I’ll get partial credit?
Regardless, quite happy with this crash score of 9176 and learned a lot along the way. I wont submit it as my entry right away because I intend to pursue finding another crash where I can hijack execution if I somehow find the time, but I wanted to get this writeup complete if for no reason other than to have a good set of notes to retrace my steps for the next time.